
|
|
|
|
| Lambda and MAF sensor display project. | |
The little movie on the left shows the behavior of the Lambda and MAF
signal at normal operation.
This shows the system at work. Nice :)
|
|
|
The Lambda sensor is an important device for the LH ecu. The Bosch LH fuel injection computer relies upon the sensors information regarding fuel/air ratio at any given time. As soon as the ecu sees a lambda value above or below 1, it adjusts the fuel injection pulse width to compensate, always trying to bring the mixture to optimal “Stoichiometric” level. This results in a closed loop then the system is operational. Ratio 14.7 air to fuel is considered Lambda value 1. In normal operation you will see the sensor first be at the middle of the curve (0.5v) until it is on operating temperature. Then it starts to move up and down the curve in a typical 3Hz frequency. The frequency at idle is very low, maybe 1Hz. A good sensor shows responsive behavior and is stays in a 3Hz closed hoop at normal driving.
Of course engine power is related to fuel mixture. Typically the lambda signal curve looks like this:
|
|
The second thing I’m interested in, is the MAF output signal, the “Mass Air Flow” sensor. This sensor informs the LH ecu of the amount of air entering the engine. This amount of air is controlled by the gas pedal, and correlates to the valve opening and the engine rpm. A good MAF should be responsive and capable of providing an output voltage between 2 and 4,5 volts nominal. Obviously a bad MAF is not able to tell the ecu how much air is flowing into the engine, and the LH adjusts the fuel injection accordingly. It is still somewhat unclear if a MAF can deliver more that 5v. Voltages like 6,45 volts have been reported with turbo or compressor charged engines. A good MAF sensor should show output like this:
The MAF starts at 2volt already when idling, which is normal. Under really heavy load you should be able to get the 5v LED on. Normal cruising will make the MAF show 2,5 to 3,5 volts. In order to get a decent display, it would be nice to have a non-linear A/D conversion for the Lambda sensor, and a linear one for the MAF. Best is to have two logarithmic LED drivers counter-linked. That will make the LED bar show the most interesting area best: the area where the curve transits from lean to rich. In order to get those two signals available, it is necessary to open the LH ecu and add a few wires. Best is to drill a little hole in the plastic frame of the connector. There is just enough room in the connector body. On dec 9th 2007 the LH ecu in my car has been modified to connect to a Lambda and MAF sensor meter using a LED display. I’ve added pin numbers for both LH 2.2 and LH2.3 ecu’s. They are different. LH 2.3 is the 928s4/gt/gts model. That is the one I built and tested. Modification is as follows:
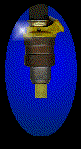
I made a nice curve form in the mounting box using the 5mm LED’s I added 10 blue 3mm leds for MAF display in the lower right corner in a 2nd order parabolic curve.
Here comes the schematic of the little circuit I made. It is based on two LM3915 which make the Lambda display, and one linear LM3914 which shows the MAF sensor output. If LED output is not too intense there’s no cooling device required for the 7805 if you keep the LED power low. There’s a few adjustments: R4= LED intensity Lambda curve. Be aware that 20 LED’s will cause heating of the 7805 voltage regulator R5= Take-over point from first to second LM3915. Adjust for a smooth transition. Adjust R5 after adjusting R4. R6= Max voltage for the MAF sensor. Adjust for LED30 to turn on a 4.75 volt R8= Lower voltage threshold for the MAF display. Adjust to make the first LED go on at 0.5v.
And this is what it looks like:
|
|
|
|
|
|
| |
|
|
| |
|
|
||
|
|
||
|
|
||